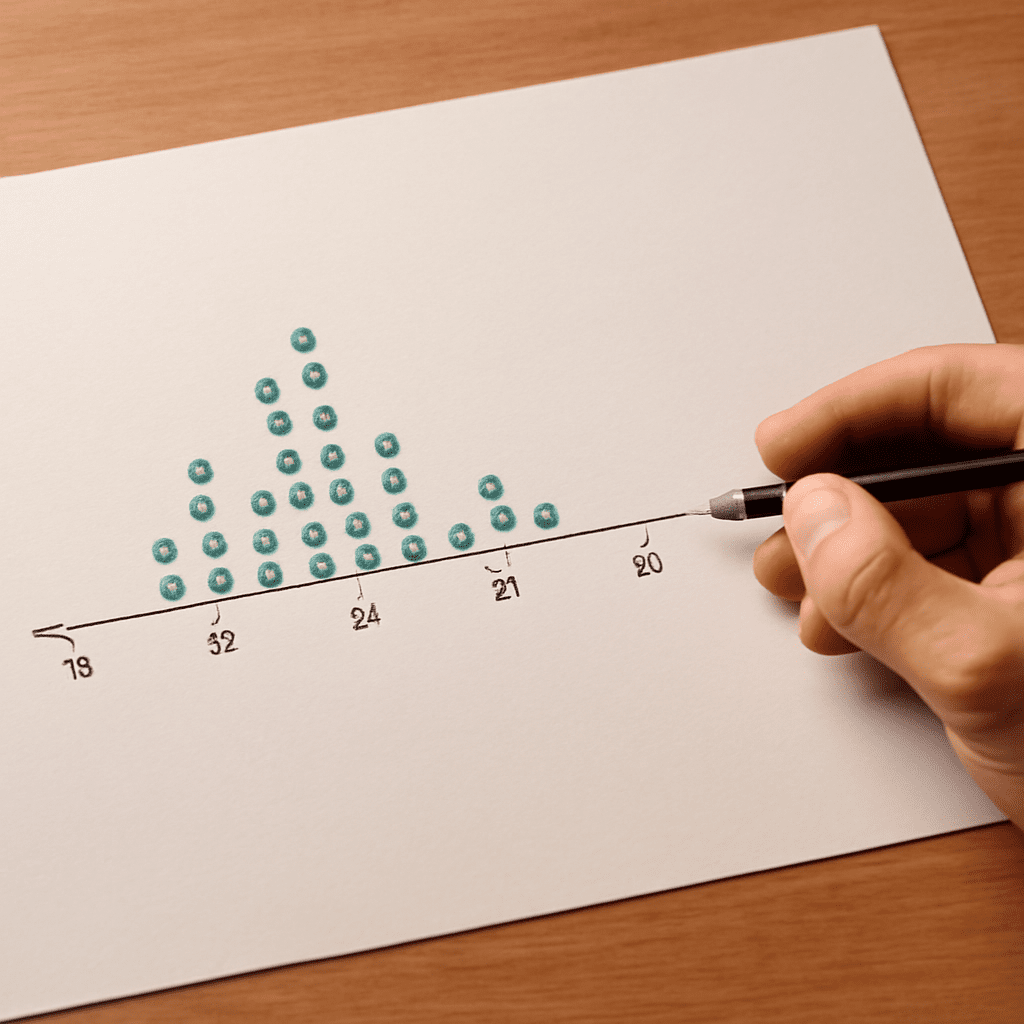
How can a small set of numbers be shown so that repeated values are easy to see? Put a dot above each observation’s position on a number line, stacking dots for repeated values. A tool that makes dot plots can do the drawing after the data are entered; the same plot can be built by hand to check the result.
Dot plot generator: enter the observations
A dot plot maker for individual numerical observations generally asks for a list of values. Some tools accept a comma-separated list, while others use a spreadsheet column. Enter every observation, including repeats. If the value 4 occurs three times, enter it three times unless the tool specifically asks for a frequency table.
Use this small dataset as an example:
2, 3, 3, 4, 4, 4, 5, 6
There are eight observations. A dot plot generator should show one dot above 2, two above 3, three above 4, one above 5, and one above 6. The highest stack is at 4, the most frequent value. The range is 6 − 2 = 4; the range measures the distance from the smallest observation to the largest, not the number of observations.
Before pressing the button to create the chart, check the tool’s input format. A value separated by a comma may be read differently in software configured for a different decimal convention. For this example, the values are whole numbers, so a single column with one number per row is an unambiguous alternative when supported.
Build the same plot by hand
Draw a horizontal number line and mark equally spaced values from 2 through 6. Put one dot above the position for each number in the list. Stack repeated values vertically, using a consistent dot size and spacing. The completed display should have these stacks:
        ●
    ●   ●
●   ●   ●   ●   ●
2   3   4   5   6
Count the dots: 1 + 2 + 3 + 1 + 1 = 8. This agrees with the number of values entered. The three dots above 4 represent three separate observations, not a single value of 3. Each dot has the same meaning throughout the plot.
Label the axis with the measured variable and its units, if any. If the numbers represent books borrowed, for example, a suitable label would be “Books borrowed per person.” A title should describe the group and period when those details are known. The example above is only an illustrative set of numbers, so it does not imply a real survey.
A dot plot creator can save time with a larger list, but a hand-drawn frequency tally is a useful independent check. Compare the value with the tallest stack, the total number of dots, and the minimum and maximum. A chart that looks plausible can still omit a repeated entry. A program that creates dot plots should preserve each repeated value as a separate observation.
Check the scale and count
The spacing on a numerical axis must represent equal differences equally. On the example number line, the distance from 2 to 3 is the same as the distance from 5 to 6. If the data also contained 10, a proportional axis would place it four units beyond 6, not immediately beside it as though the gap were one unit.
A dot plot maker may let the user set the axis minimum, maximum, and tick interval. The axis must include every value. Showing a little space beyond the endpoints can make dots easier to read, but the labels should not suggest values that were observed when there are no dots there. If the program groups values into bins instead of placing them at exact positions, its display answers a slightly different question.
The scale also depends on what one dot represents. In the example, one dot represents one observation. Some displays use one dot for several observations or allow points to overlap. Read the legend and settings before counting. A graphing tool for dot plots may also offer a frequency view for checking the stacks. For a one-dot-per-observation plot, a mismatch between the input count and the visible dot count is a reason to inspect the data and display settings.
Read patterns without adding claims
The example has a cluster around 3 and 4, with the largest stack at 4. Its values span 2 through 6. The display makes those features easy to see, but it does not explain why they occurred. Without knowing how the data were collected, it cannot establish that they represent a larger population.
A dot plot generator can help compare two groups if each plot uses the same variable, units, and scale. One group might have a wider spread or a different most common value. Before interpreting the difference, check that the groups were measured in comparable ways and note their sample sizes. A taller stack can reflect more observations, not necessarily a higher proportion.
A dot plot maker and a frequency table offer two views of repeated values: 2 occurs once, 3 twice, 4 three times, and 5 and 6 once each. Adding frequencies checks the total. If the dot chart and the table disagree, find the particular value where the counts differ before revising either one.
Distinguish other charts with dots
The name “dot plot” can also describe other displays. A scatterplot uses each dot for a pair of measurements, such as height and weight, positioned on two numerical axes. The one-variable plot above uses each dot for one value on one number line; its vertical stack indicates frequency rather than a second measurement.
A dot chart can instead place one dot on a scale for each category, such as one dot for each state’s average. In that case, a dot represents a summary, not an individual observation. Read the title, axis labels, and legend to establish what is being plotted before comparing displays or choosing a program.
Quick plot check
- Enter every observation once and preserve repeated values.
- Confirm that each dot’s meaning and the axis units are stated.
- Check equal numerical spacing, endpoints, and the program’s grouping settings.
- Count the dots and compare each stack with a frequency tally.
- Describe the observed pattern and its limits in the context of the data.